- Management Consulting
- Smart Enterprise
- Data & Analytics
- Cyber Security
- Customer Success | AMS
- Products
- Success Stories
- Corporate Social Responsibility
- Diversity
Monitor sales numbers and pricing to see their impact on the development of business figures such as EBIT or operating income.
Simulate changes in quantities sold, price corrections or other developments in volatile markets and see the results immediately to make the right decisions.
See at a glance whether your planned sales figures are being achieved or your forecast is in line with the plan so that you can take early action if necessary.
The model consists of seven dimensional tables and two relation tables filled with CSV files. These relation tables are combined to form a coherent dataset view. The representation is analytical and combines the transaction data with the master data. This representation is then used as a data source in the SAP Analytics Cloud.
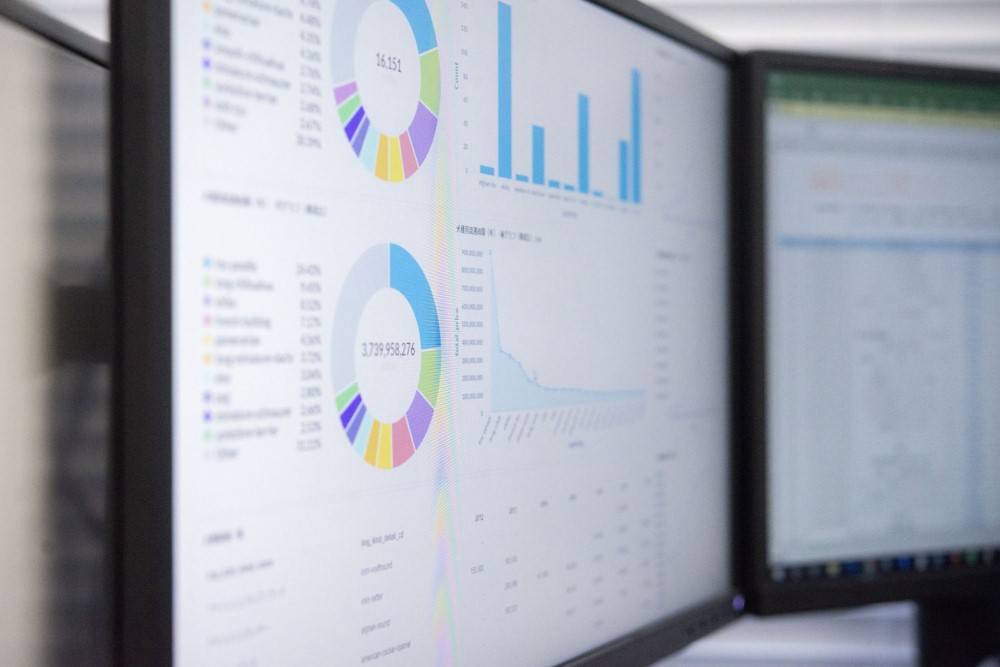
The dashboard consists of four pages in total, plus an additional page with further information about IBsolution GmbH.
The first page gives an overview of the key figures from a profit and loss scheme and shows the development in the years 2019/2020.
The second page deals with the temporal development of gross and net sales, filtered by sales channels.
The third page again deals with the topic "sales channel", but this time it is about predictions about the future EBIT in a time series diagram and the different dimensions in a table.
Step 1:
Fill in the form and submit it (please make sure the data is complete).
Step 2:
IBsolution activates your tenant for the content package.
Step 3:
You will receive a mail with all necessary instructions for the installation of the content package including sample data (max. within 2 working days).
Benefit from our Know-how

Learn more about the most important fields of application and benefits of the SAP Data Warehouse Cloud.

